
Reliability Management
Planned Maintenance System and fleet reliability
Learning objectives
- Distinguish the four maintenance strategies and choose the appropriate one for each component.
- Apply Reliability Centered Maintenance (RCM) logic to decide how to manage a critical component.
- Interpret the bathtub curve and its impact on maintenance planning.
- Build and manage a spare parts criticality matrix.
- Monitor reliability metrics such as MTBF and availability.
- Assess the digital maturity level of their fleet's maintenance and the steps to progress.
The four maintenance strategies
Module objective Select a strategy by function, failure mode, consequences and applicable requirements.
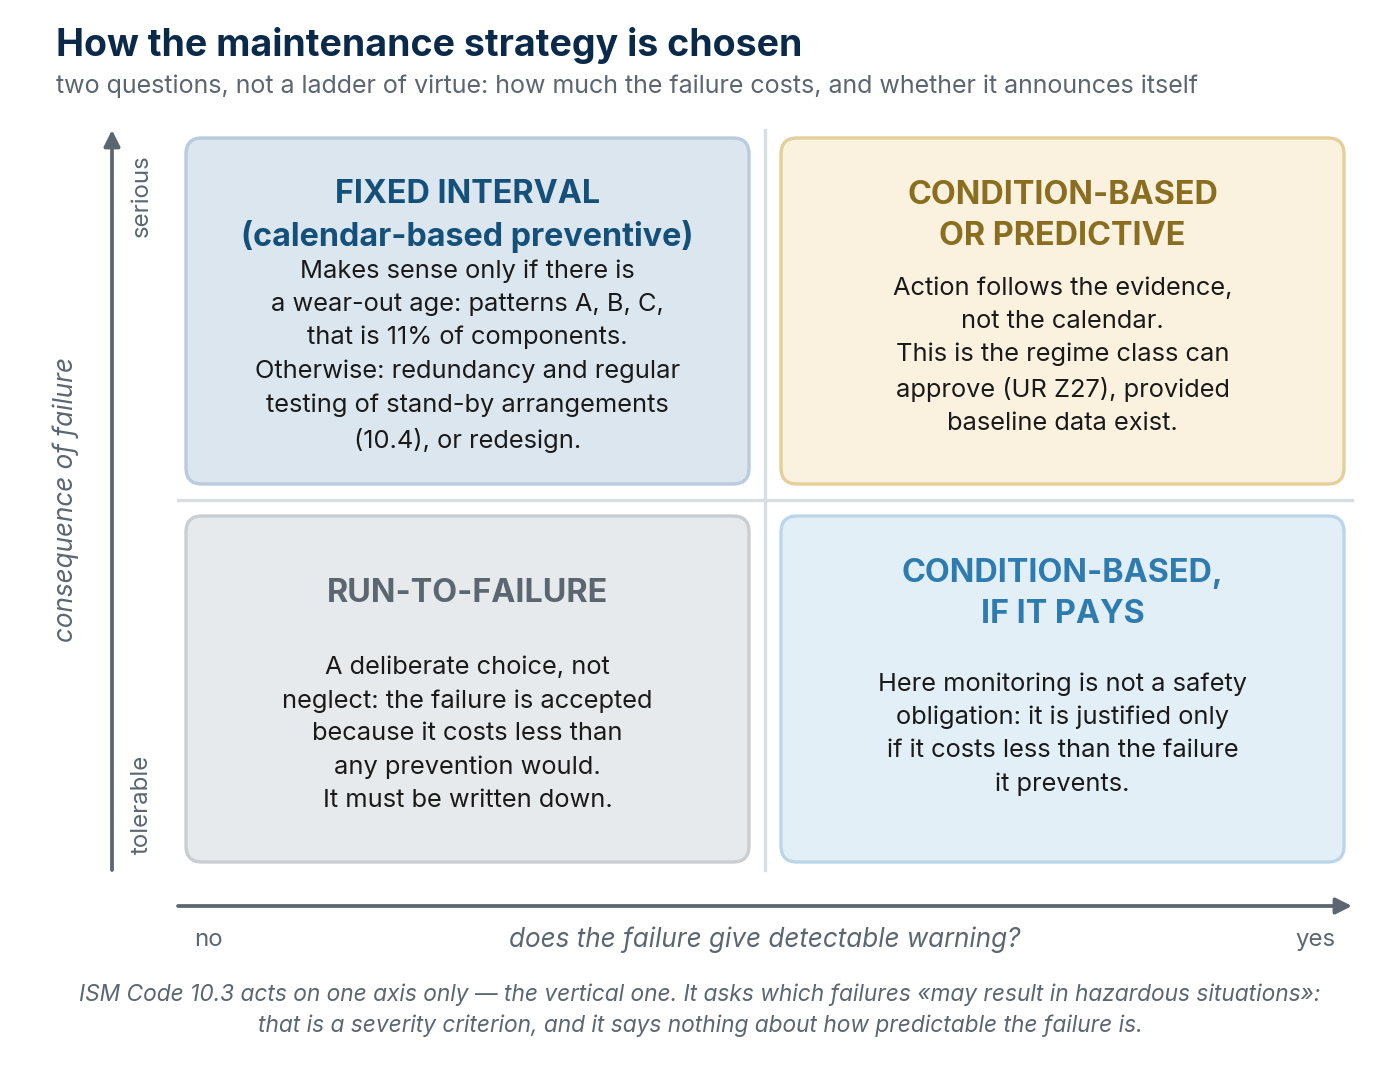
A ship combines reactive, fixed-interval preventive, condition-based and predictive maintenance. Justify the choice by function and failure mode: criticality, detectable deterioration, task effectiveness and cost are different considerations. Applicable requirements and technical instructions still apply.
Run-to-failure may be appropriate when consequences are tolerable and it does not conflict with duties or protective functions. Low replacement cost and redundancy are insufficient: consider hidden failures, common causes and actual standby availability. Fixed-age intervention needs a usable relationship between age or usage and failure, or an applicable requirement.
CBM links intervention to condition measurements; predictive maintenance may develop its prognostic element by estimating progression, probability or time to failure. Remaining useful life is one possible output. These categories overlap; none is automatically the best level.
Key takeaways
- Select the strategy by function and failure mode.
- Redundancy and low cost do not automatically justify run-to-failure.
- CBM and prediction need useful signals and a practicable maintenance decision.
How the failure rate varies: the bathtub and the other five curves
Module objective Interpret failure patterns without generalising aviation statistics to marine assets.
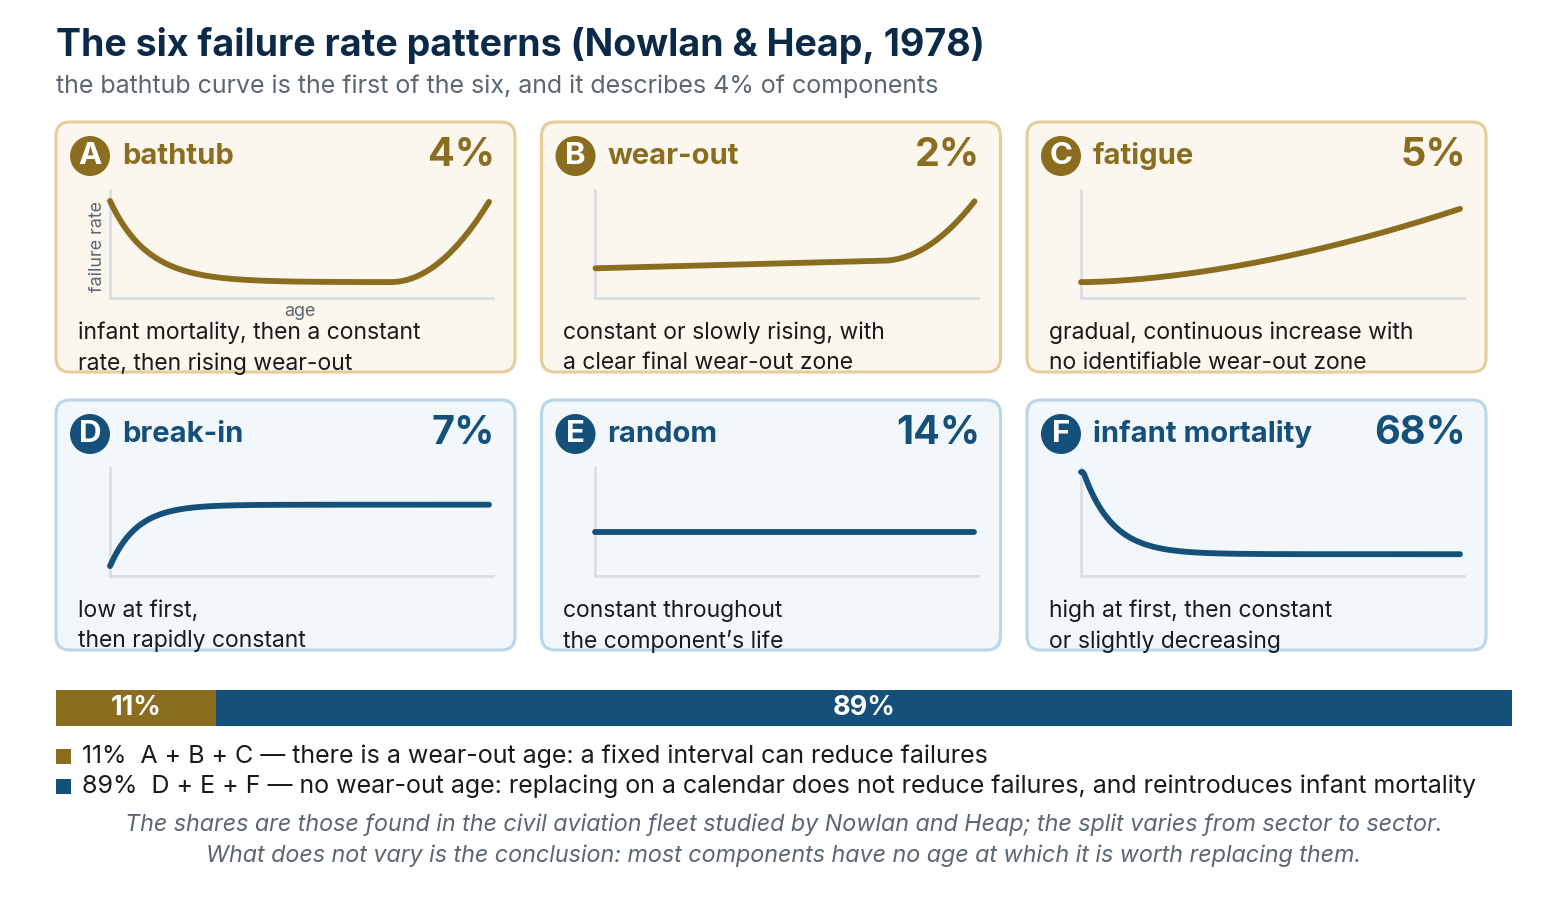
The bathtub curve is one possible model: an initially declining rate, a roughly constant phase and a later increase. Conditional failure rate is not cumulative failure probability. The plotted curves are schematic and have no quantitative time scale.
In the historical aviation dataset discussed by Nowlan and Heap (1978), the shares were A 4%, B 2%, C 5%, D 7%, E 14%, F 68%. A, B and C totalled 11%; D, E and F 89%. The latter forms lack an identified final wear-out zone, but D and F still show an early age-related change. Calling all three age-independent is incorrect.
The shares are not a universal maritime distribution. Even a rising rate, such as C, does not alone establish an optimal replacement age. Evidence is needed about the failure mode and intervention effectiveness. Intrusive maintenance can introduce assembly defects or contamination; it does not automatically reset the entire asset to an identical initial state. Commissioning and post-maintenance verification reduce that risk.
| Pattern | Failure rate behaviour | Historical aviation share |
|---|---|---|
| A — bathtub | Infant mortality, then a constant rate, then rising wear-out | 4% |
| B — wear-out | Constant or slowly rising, with a clear final wear-out zone | 2% |
| C — gradual increase | Gradual, continuous increase with no identifiable wear-out zone | 5% |
| D — break-in | Low at first, then rapidly constant | 7% |
| E — random | Constant throughout the component’s life | 14% |
| F — infant mortality | High at first, then constant or slightly decreasing | 68% |
Key takeaways
- The six curves model conditional failure rate.
- The 11%/89% split comes from historical aviation data.
- An effective interval needs evidence about the failure mode and intervention.
Reliability Centered Maintenance (RCM)
Module objective Connect functions, failures and consequences to RCM decisions, distinguishing this course from the full standard.
RCM starts with functions and performance standards in the operating context. It identifies functional failures, failure modes, effects and consequences before selecting tasks and intervals. It is more than rearranging existing PMS jobs.
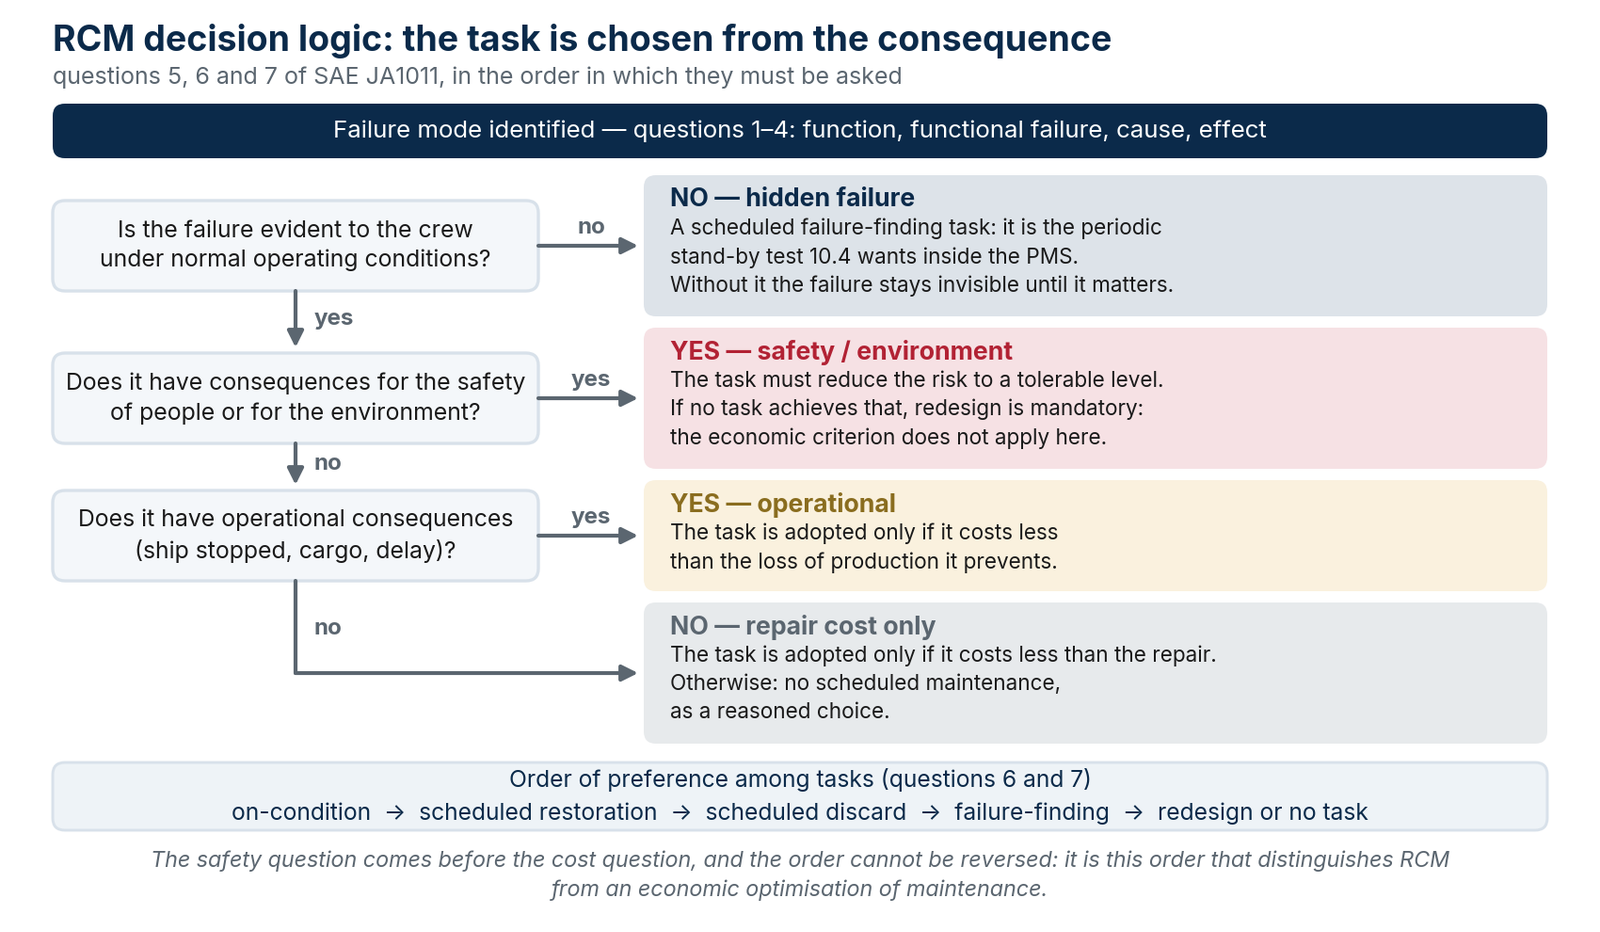
SAE JA1011 sets evaluation criteria for RCM processes; the published revision is JA1011_202411 (November 2024). JA1012_201108 provides supporting guidance. The seven questions are essential orientation, but answering them alone does not demonstrate compliance with all standard criteria. The course diagram is a simplified aid, not a normative flowchart.
For each failure mode, assess technical feasibility and task effectiveness against consequences. For hidden functions consider failure-finding and multiple-failure risk; where tasks cannot adequately control safety or environmental consequences, assess the required modification. No scheduled maintenance may be a justified decision only where consequences and requirements permit it.
| # | Teaching summary of the seven questions |
|---|---|
| 1 | Context, functions and required performance |
| 2 | Functional failures |
| 3 | Failure modes producing them |
| 4 | Failure effects |
| 5 | Failure consequences |
| 6 | Feasible, effective proactive tasks and intervals |
| 7 | Default actions: failure-finding, modification or no task, depending on consequences |
Key takeaways
- RCM begins with functions in their operating context.
- The teaching diagram does not replace JA1011 criteria.
- Default actions depend on consequences, including hidden-failure consequences.
Planned Maintenance System: structure and governance
Module objective Assess company PMS structure, maintenance records, responsibilities and control of deviations.
The PMS is how the Company plans, performs, records and controls maintenance. The ISM Code prescribes no particular software. Controlled paper records and digital systems must both support actual work, responsibilities and traceability.
It needs asset functions and identifiers, jobs with instructions and intervals, owners, records of outcomes and measurements, overdue control and links to spares. Distinguish planned, completed and verified work; retain failures and abnormal results even when a job is closed.
Technical judgement supplements the programme but does not by itself authorise deferral of a mandatory deadline. Document reasons, risk, temporary controls, a new due date and required approvals. The company maintenance system differs from a class-approved Planned Maintenance Scheme, which concerns an approved survey scope, as explained in module 11.
| Component | Function |
|---|---|
| Machinery register | Structured list of all systems and components subject to maintenance |
| Job list and intervals | Definition of maintenance activities and their frequency |
| Recording of interventions | History of every intervention carried out, with date, performer, outcome |
| Deviation (overdue) management | Monitoring of jobs not carried out within the scheduled deadline |
| Integration with spares management | Link between maintenance jobs and availability of required spares |
Key takeaways
- The PMS controls the complete maintenance cycle.
- Overdue work needs documented assessment and management.
- Company PMS and class-approved PMS scheme are distinct.
Critical equipment and critical spares management
Module objective Translate ISM section 10.3 into item identification, reliability measures and a spares policy.
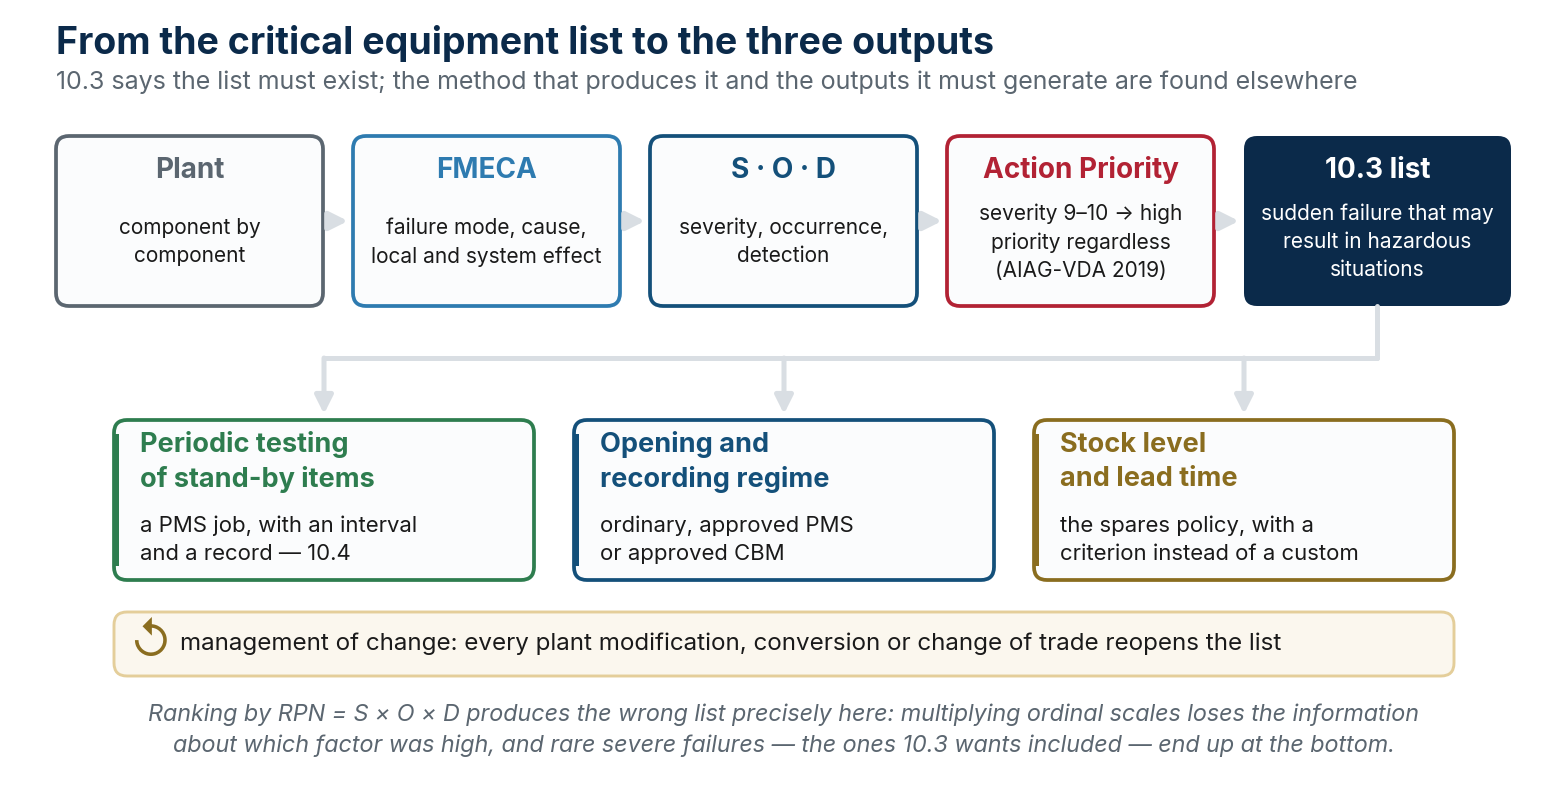
ISM section 10.3 requires identification of equipment and systems whose sudden operational failure may create hazardous situations, with specific reliability measures. A controlled list is a useful way to document this; the Code does not prescribe a separate document named critical equipment list.
Regular testing of standby arrangements and equipment not in continuous use belongs to section 10.3. Section 10.4 integrates inspections and measures into the operational maintenance routine without prescribing a single software system or register. Applicable SOLAS and other redundancy requirements remain in place.
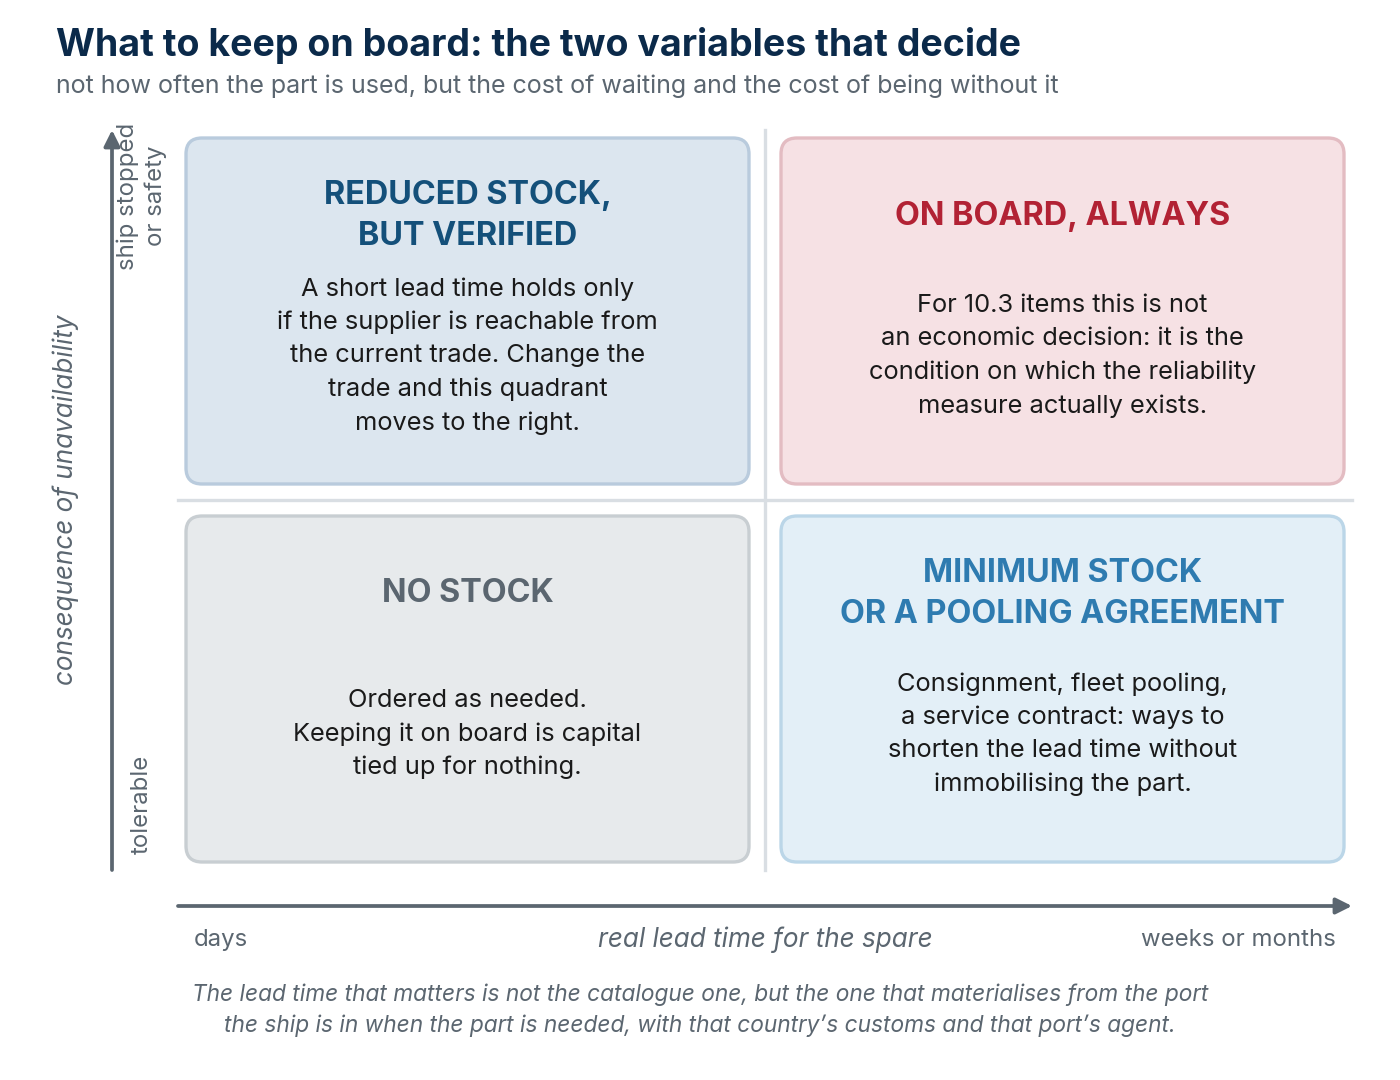
Stock decisions depend on unavailability consequences, effective redundancy and lead time on actual routes, including customs and delivery. Consider compatibility, traceability, preservation, expiry and installation competence. Criticality does not automatically require every spare on board, but it does require adequate, verifiable measures; prescribed spare holdings still apply.
Key takeaways
- Section 10.3 requires identification and specific reliability measures.
- Testing is in 10.3; section 10.4 integrates it into the routine.
- Stock decisions reflect consequences and actual spare availability.
How the critical equipment list is built
Module objective Use FMEA/FMECA and distinct criticality criteria to justify actions without relying on RPN alone.
FMEA examines functions, failure modes, causes and local and system effects; FMECA adds criticality assessment. IEC 60812:2018 is the generic reference. Record controls, actions, owners and verification; consider interfaces, hidden failures and common causes as well as individual components.
RPN = S × O × D combines ordinal scales and is not a physical risk measure. In the teaching example S9/O2/D3 gives 54, whereas S3/O6/D6 gives 108: ranking alone may conceal a severe consequence. Define the scales: under the usual convention, high D means poorer detection capability. The automotive AIAG–VDA 2019 handbook introduces Action Priority tables; it is not a mandatory maritime standard. Do not infer an AP category from severity alone without the applicable table.
ISM identification remains independent of scoring methodology. Safety, operational continuity and survey coverage are different dimensions; one register can retain their separate criteria. An unavailable emergency generator may prevent departure; a crane failure may be hazardous; a boiler alarm may fall within surveys. Do not exclude such consequences by category. Review identification after modifications, failures and changes in operating context.
Key takeaways
- FMEA/FMECA records failure modes, effects and actions.
- RPN and Action Priority do not replace ISM identification.
- Safety, operations and surveys need separate, coordinated criteria.
Reliability metrics
Module objective Define MTBF, MTTF, MTTR and availability using consistent boundaries and assumptions.
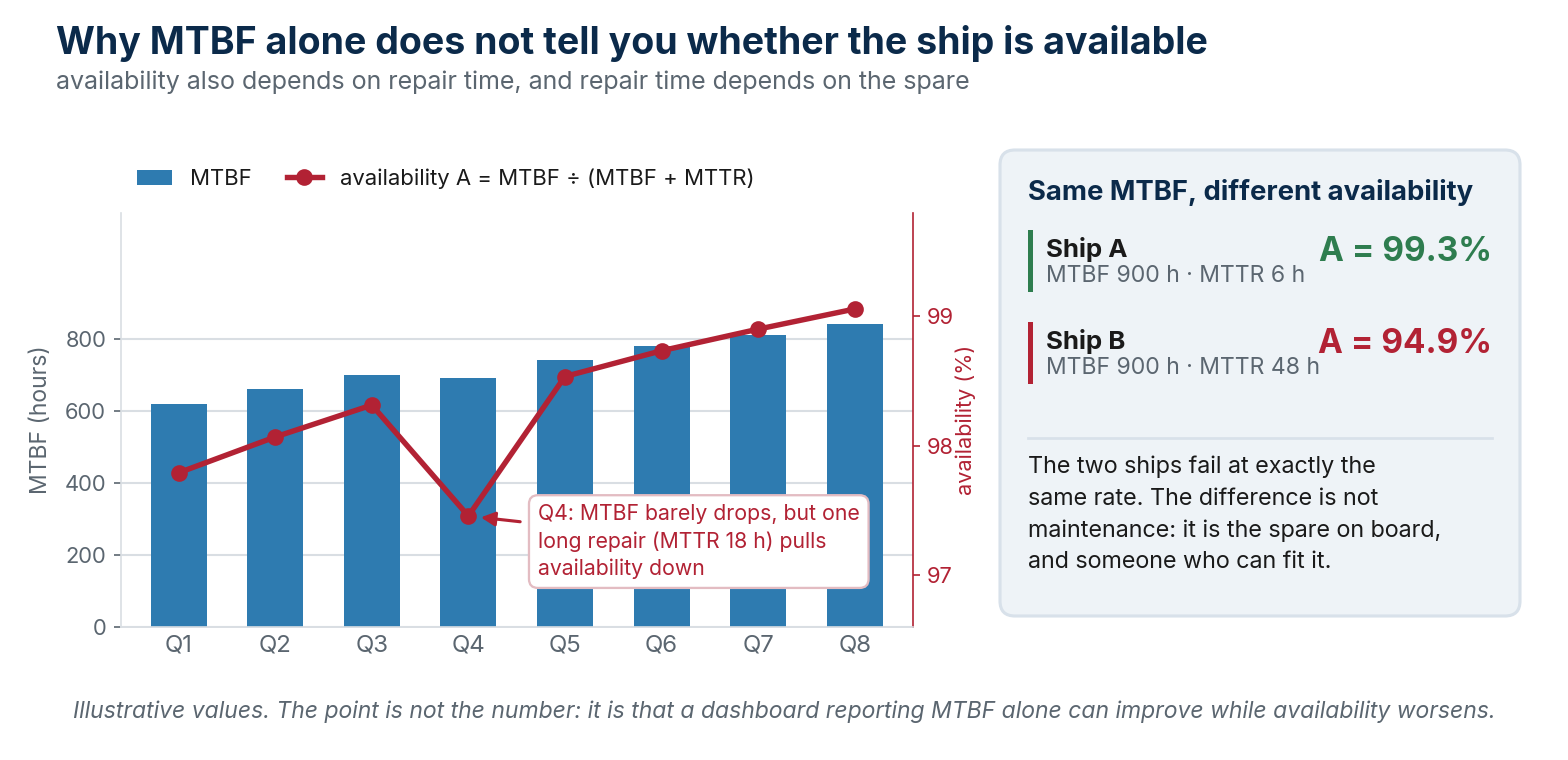
For repairable assets, operating hours divided by observed failures describe sample mean operating time between failures. State period, population, failure mode and event count. Do not confuse MTBF with service life or mission success probability. Zero observed failures do not demonstrate infinite reliability.
MTTF concerns time to failure of items non-repairable at the chosen level. The average of complete lifetimes is appropriate for complete observations; surviving units create censored data requiring suitable methods. Exposure divided by failures is an estimator under specific assumptions, such as an exponential model, not a universal mean-life formula.
In the chart MTTR means average active corrective repair time. Aᵢ = MTBF/(MTBF + MTTR) is simplified steady-state inherent availability for a two-state repairable item; it excludes preventive maintenance and logistical or administrative delay. For operational availability define required time, required capability and downtime categories, then measure available time over required time. Spares, diagnosis, access and competence affect restoration; the chart isolates no cause. Backlog comprises pending work; overdue jobs are its past-due portion. For standby items also consider tests and failures on demand.
Key takeaways
- MTBF is not service life; state exposure and failure counts.
- MTTF with incomplete observations requires censoring treatment.
- The inherent formula alone does not measure ship operational availability.
Condition Based Maintenance: the main techniques
Module objective Choose CBM techniques suited to the failure mode and available intervention time.
CBM uses measured condition to decide intervention. It may reduce unnecessary maintenance and failures only if relevant deterioration is detectable early enough. The P–F interval runs from detectable deterioration to functional failure; measurement frequency must leave time for analysis, supply and intervention.
Vibration: imbalance, misalignment and faults in rotating machinery. Oil: contamination, particles and degradation, using representative sampling. Thermography: thermal anomalies interpreted against load and emissivity. Ultrasound: selected leaks and defects, depending on technique and application. No single measurement identifies all causes with certainty.
Suitable calibrated instruments, comparable measurement conditions, baseline, justified thresholds and competent personnel are needed. Monitoring may be periodic or continuous. Internal CBM does not itself require class approval; where it is to change surveys or obtain survey credit, the relevant approval process in module 11 applies.
| Technique | What it detects | Typical application |
|---|---|---|
| Vibration analysis | Imbalances, misalignments, bearing wear | Engines, pumps, compressors, generators |
| Lubricating oil analysis | Metal particles, contamination, additive degradation | Main engine, reduction gears |
| Infrared thermography | Abnormal hot spots, faulty electrical connections | Switchboards, bearings, seals |
| Ultrasonics | Air/gas leaks, defects in slow-rotating bearings | Pneumatic systems, valves |
Key takeaways
- The technique must detect the failure mode with useful warning.
- Baseline, load and measurement quality affect interpretation.
- Internal CBM and CBM used for class survey credit are distinct.
Predictive maintenance and data analysis
Module objective Assess data quality, uncertainty and decision use of a predictive model in its operating context.
Prediction uses data and models to anticipate condition or failure progression. Outputs may include probability, time to failure or Remaining Useful Life. Models may be physical, statistical or machine learning; continuous sensors across an entire fleet are not always necessary.
First define the decision and useful warning time. Select data representative of load and context, check missing measurements and asset changes, and validate against data independent of model development. Assess false alarms, missed failures and prediction uncertainty.
Assign responsibility for interpretation, escalation and decisions. Monitor model performance degradation as ships, sensors or operating conditions change. Output supports technical judgement; it does not automatically authorise PMS deferrals, changes to safety limits or survey arrangements.
Key takeaways
- Remaining useful life is one of several possible predictions.
- Validate the model in context and state uncertainty.
- Prediction supports a technical decision with defined accountability.
The digital maturity scale of maintenance
Module objective Use digital maturity as a planning aid for maintenance capabilities rather than a mandatory ladder.
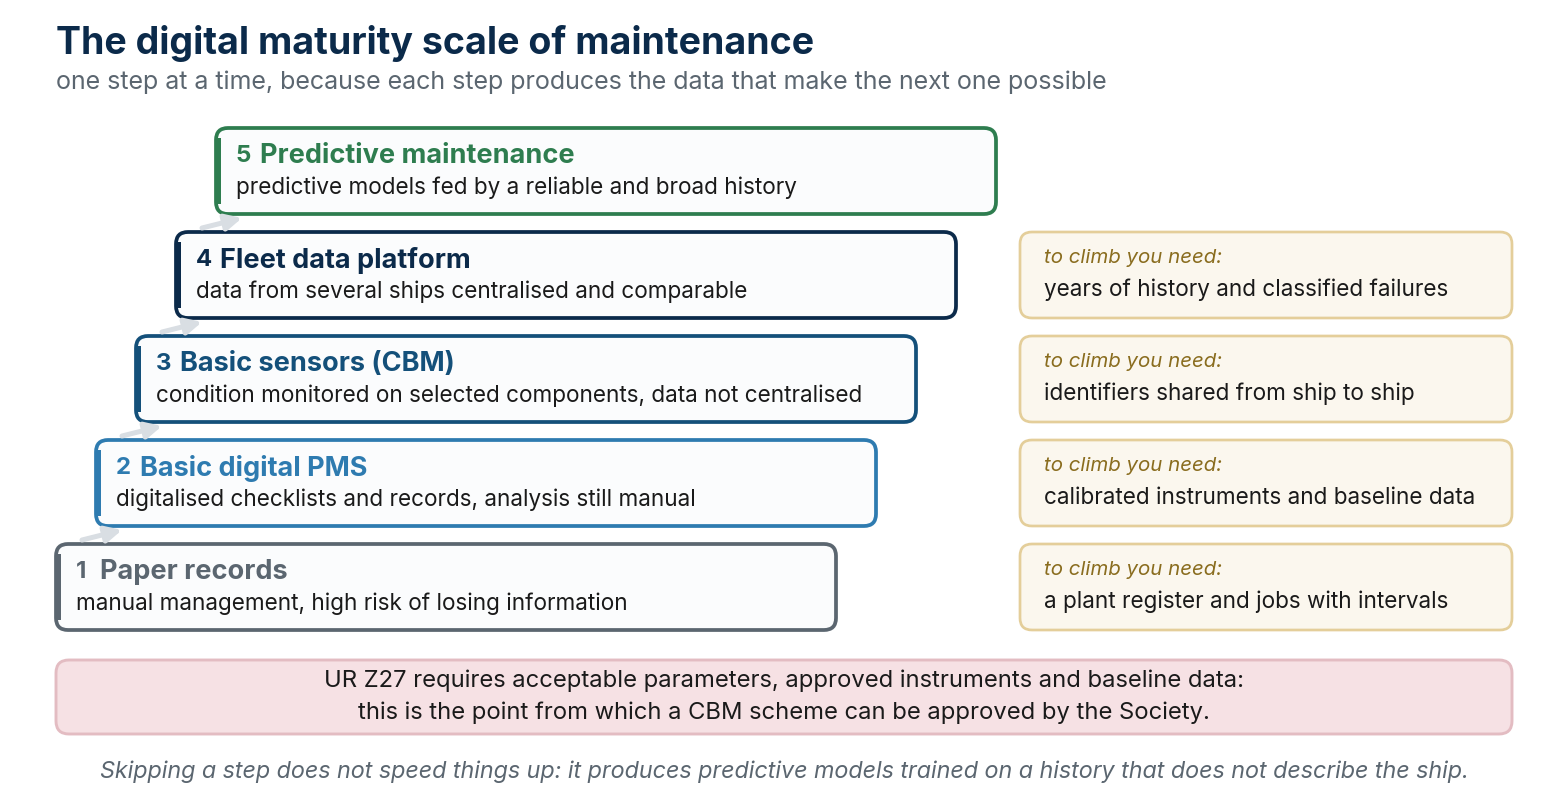
The chart is an illustrative course model: controlled records, digital PMS, monitoring, data integration and prediction are capabilities that may develop in different combinations. It is not an IACS ladder and does not require every level to be completed before the next.
Paper records can also provide reliable history. Digitalisation improves access and comparison but does not itself repair inconsistent identifiers, incorrect hours or unreported failures. A central fleet platform can help; it is not a universal prerequisite for prediction.
Choose investments against actual decisions and risks: data quality, interoperability, authorised access, backups and continuity during connection loss. Where data support a class scheme, also align instruments, baseline and change control with approval conditions.
Key takeaways
- The digital model is illustrative, not an IACS requirement.
- Data quality matters before digitalisation too.
- Required capabilities depend on purpose, risks and approvals.
Maintenance and class: the three machinery survey regimes
Module objective Distinguish the Z18, Z20 and Z27 frameworks and verify the actual class-approved maintenance scope.
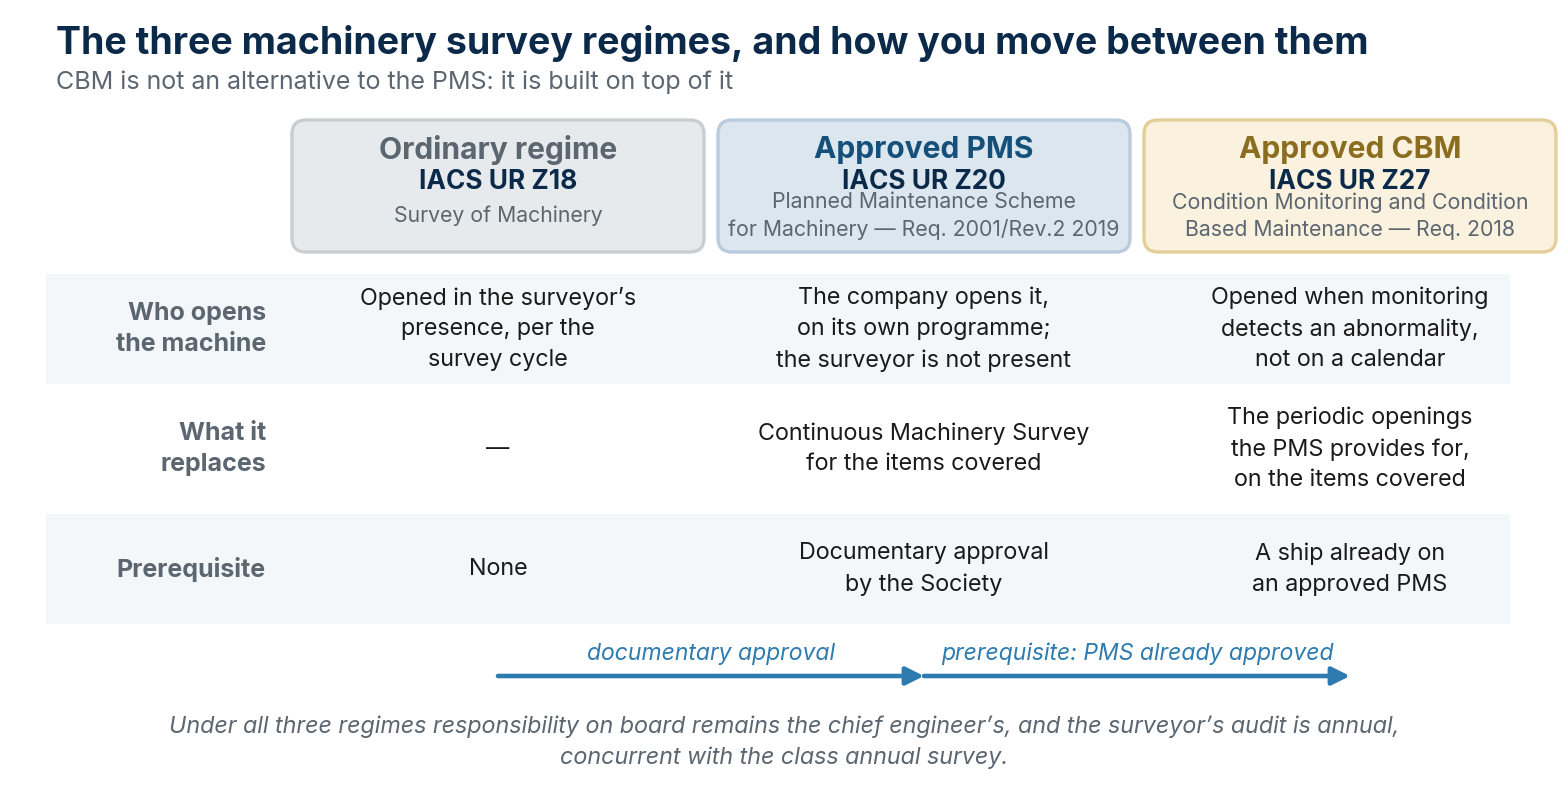
IACS Unified Requirements establish minimum requirements incorporated into members’ rules, which may impose additional requirements. Z18, Z20 and Z27 are related frameworks that may coexist by item, not three mandatory steps for the whole ship. Class recognition does not remove statutory duties.
Z18 concerns machinery surveys under the applicable cycle and rules. Z20 addresses an approved PMS scheme as an alternative to Continuous Machinery Survey for included items. Z27 concerns CM/CBM used to influence survey scope or frequency and requires a vessel already operating an approved PMS. Excluded items continue under Z18 and/or Z20. This does not mean opening only after an anomaly: class retains the right to require tests or opening-up.
For Z27 check approved scope, instruments, parameters and baseline, qualified personnel, change control and records. The Chief Engineer retains onboard responsibility with external support. Installation and implementation surveys and annual audits are required; submitting documents alone is insufficient. Initial readings can form the baseline; years of history are not mandatory. Unsatisfactory operation may lead to cancellation; class determines consequent credits and surveys rather than automatic opening of everything.
Key takeaways
- Frameworks may coexist by item on the same ship.
- CM/CBM survey credit needs an approved scheme and scope.
- Favourable monitoring does not prevent class from requiring checks.
The human factor in maintenance
Module objective Connect competence, working conditions and verification to maintenance quality.
Maintenance depends on people, resources and organisation. Turnover, incomplete handovers, operational pressure, fatigue and unusable procedures can undermine work. Do not reduce analysis to motivation or individual error alone.
Plan competent personnel, time, spares and tools. Apply energy isolation, permits and procedures relevant to the task. After intervention verify assembly, removal of tools and temporary safeguards, reinstatement of alarms and safe functional testing; use independent checks where required or justified by criticality.
A PMS without overdue jobs may reflect good management or inaccurate records. Cross-check documents, observations, measurements, failures and crew interviews. Retain anomalies and open actions, encourage reporting and share lessons between ship and technical office.
Key takeaways
- Competence and organisational conditions affect results.
- Intervention includes isolation and restoration verification.
- Verify quality through different evidence, not the register alone.
Emerging trends
Module objective Assess data integration and maintenance contributions to efficiency without assuming automatic benefits.
Z27 was adopted in July 2018, with uniform implementation for schemes approved on or after 1 January 2020. This is neither the origin of CBM nor evidence of fleet adoption rates. Assess the actual usefulness of monitoring in the Company’s context.
More accessible sensors and shore analysis can extend monitoring. Competent interpretation, secure connections and continued onboard operation without connectivity remain essential. Fleet comparisons need common definitions, exposure and comparable operating conditions; a difference in MTBF alone does not prove better maintenance.
Effective maintenance may limit deterioration that increases consumption. Assess the contribution to carbon intensity alongside speed, load, route, weather and hull and propeller condition. It does not automatically improve the CII rating. Reliability and energy efficiency share data and need collaboration across different competences.
Key takeaways
- Z27 distinguishes adoption in 2018 from application to schemes from 2020.
- Valid fleet comparisons need comparable data and operating conditions.
- Maintenance may support efficiency; a better CII rating is not automatic.
Recurring mistakes
From the Mistake Library of SuperbaKnowledge, filtered to the subjects this course covers. This view selects and organises content published in SuperbaKnowledge; it does not modify or replace it. The linked Knowledge page remains the reference version, while official texts remain authoritative.
| Topic | Mistake | Typical consequence | Topic sheet |
|---|---|---|---|
| IoT Predictive Maintenance | Sensors installed but data collected without systematic trend analysis | Impending failure not anticipated despite the instrumentation being available | See the topic sheet |
| Planned Maintenance System | Standby equipment not tested because it is 'not in use' | A failure of the primary unit reveals that the standby unit doesn't work either | See the topic sheet |
| Engine Room Energy Efficiency | Engine performance deterioration attributed generically to 'wear' without checking hull/propeller fouling | Hull cleaning not scheduled in time, growing impact on consumption | See the topic sheet |
| Critical Spare Parts Management | Critical spares list not updated after changes to the identified critical equipment | Missing spares for equipment recently classified as critical | See the topic sheet |
| Fire Pumps and Fixed Systems in the Engine Room | Emergency pump test conducted using the same power supply as the main engine room | The test does not genuinely verify the emergency condition the pump is designed for | See the topic sheet |
| Bunkering Operations and Fuel Quality Control | Pre-bunkering safety checklist completed as a formality without genuine verification of conditions | Spill risk not adequately mitigated | See the topic sheet |
| Cyber Risk Management of Automation Systems | OT and IT networks not segmented, with shared access points | A compromise of the IT network (e.g. via email) can propagate to critical control systems | See the topic sheet |
Related PSC deficiencies
From the PSC Knowledge Base of SuperbaKnowledge. This view selects and organises content published in SuperbaKnowledge; it does not modify or replace it. The linked Knowledge page remains the reference version, while official texts remain authoritative.
| Deficiency | Regulation | Indicative frequency | Possible consequence | Topic sheet |
|---|---|---|---|---|
| Non-functioning emergency fire pump or insufficient pressure | SOLAS Chapter II-2, Reg. 10 | Not quantified in this course | Serious deficiency, possible detention | See the topic sheet |
Glossary of acronyms
| Acronym | Definition |
|---|---|
| AI/ML | Artificial Intelligence / Machine Learning |
| CBM | Condition-Based Maintenance |
| CMS | Continuous Machinery Survey |
| FMEA / FMECA | Failure Modes and Effects Analysis / Failure Modes, Effects and Criticality Analysis |
| CII | Carbon Intensity Indicator |
| ISM | International Safety Management Code |
| MTBF | Mean Time Between Failures |
| MTTF | Mean Time To Failure — for non-repairable components |
| MTTR | Mean Time To Repair |
| PMS | Planned Maintenance System |
| RCM | Reliability Centered Maintenance — in the sense of SAE JA1011 |
| RUL | Remaining Useful Life |
References and sources
Sources and references reviewed on 15 September 2026. SAE and IEC catalogue pages confirm edition and scope; this course does not replace the complete standards. Nowlan and Heap (1978) is a historical reference also discussed in the NASA guide. Check applicable class rules, ISM amendments and manufacturer instructions for the asset.
- IACS UR Z18 — Rev.9, April 2020
- NASA — inherent availability and exclusions
- IMO — CII and operational efficiency
- ISM Code — A.741(18), §10
- IACS UR Z20 — Rev.2, May 2019
- IACS UR Z27 — July 2018, §§1–3
- SAE JA1011_202411 — RCM evaluation criteria
- SAE JA1012_201108 — RCM guide
- IEC 60812:2018 — FMEA/FMECA
- AIAG — 2019 FMEA handbook and Action Priority
- NASA — RCM Guide, September 2008; historical Nowlan–Heap patterns
- NIST — censored reliability data
- NIST — constant-rate estimation assumptions
IACS UR Z18 — Survey of Machinery; IACS Rec. No. 74 — Managing Maintenance; Nowlan & Heap, Reliability-Centered Maintenance (1978); Moubray, RCM II: supplementary references to consult in the relevant edition.
This course is educational material for training purposes and does not constitute a professional certification or qualifying credential. Read the full disclaimer.